
This article examines residential housing activity across nine major Indian markets during the first two quarters of FY 2026–27:
- FY-Q1: April–June 2026.
- FY-Q2: July–September 2026.
The analysis uses city-wise housing-sales figures published by PropEquity and reported by Indian news organisations. These figures offer a consistent way to compare market activity across the two quarters. They do not represent the number of newly approved retail home loans.
The nine markets covered are Bengaluru, Hyderabad, Chennai, Mumbai, Navi Mumbai, Thane, Pune, Delhi-NCR and Kolkata. Together, they provide a useful picture of how residential demand is developing across several major urban centres.
India's Housing Market: An Overview
During April–June 2026, housing sales across the nine tracked markets reached 112,458 units, an increase of 19% compared with the same quarter in 2025. New residential supply rose by 43% year-on-year to 117,609 units.
This indicated strong market activity during the first quarter, with developers introducing more homes and buyers completing more purchases than a year earlier.
The following quarter, July–September 2026, recorded 103,170 housing sales, approximately 6% below the 109,420 units sold during July–September 2025. New residential supply also declined, from 100,330 units to 98,165 units.
These figures suggest that the market moderated during the second quarter. However, the national-level trend does not tell the whole story: individual cities performed differently, with some continuing to grow while others experienced lower sales.
City-Wise Housing Sales Comparison
The following table compares the number of homes sold in each market during FY-Q1 and FY-Q2.
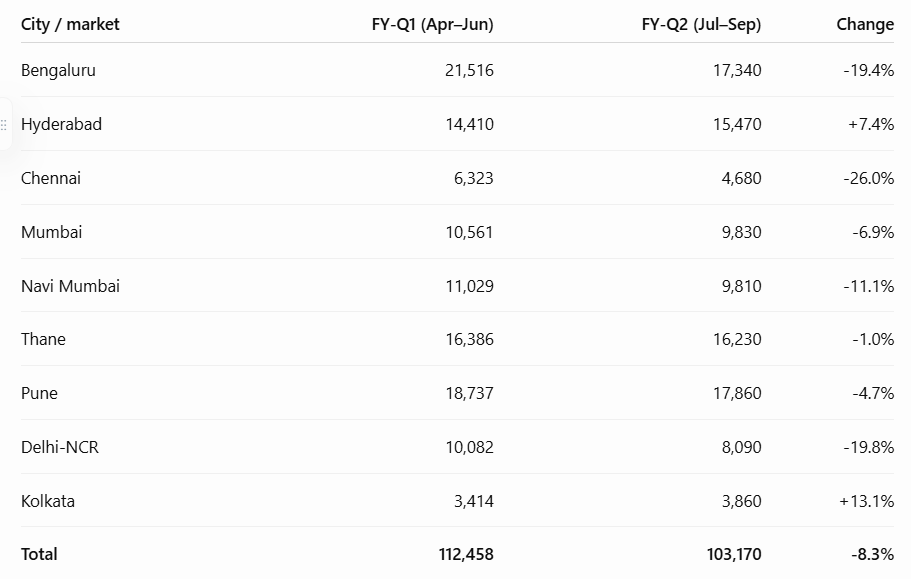
Change represents the difference between the two consecutive quarters, calculated from the reported sales figures. It is not a year-on-year growth rate.
The table reveals three important patterns.
First, Hyderabad and Kolkata recorded higher sales in July–September than in April–June. Second, several major markets, including Bengaluru, Chennai and Delhi-NCR, experienced a notable reduction in quarterly sales. Third, Thane and Pune remained relatively close to their first-quarter levels.
Quarterly changes can be influenced by seasonal purchasing patterns, project launches, supply availability and the timing of property registrations or sales. Therefore, a decline from one quarter to the next does not necessarily mean that a city's long-term property market is weakening.
Understanding the Quarterly Chart
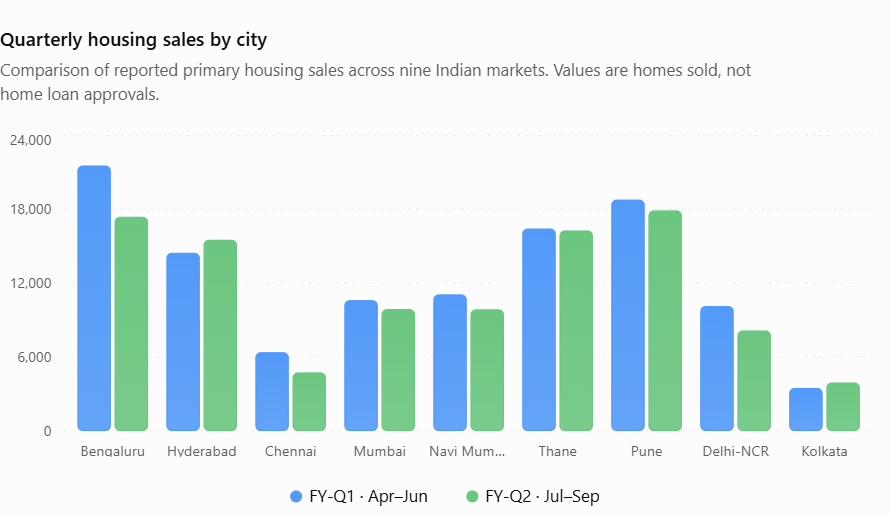
The chart compares FY-Q1 and FY-Q2 sales for all nine markets. Each city has two bars, making it easy to see which markets recorded higher or lower sales in the second quarter.
The figures show that Bengaluru and Pune remained among the largest markets by sales volume in both quarters. Hyderabad was the notable exception to the general quarterly decline among the larger markets, while Kolkata recorded an increase from a smaller base.
Chennai recorded the sharpest percentage reduction among the nine markets in this quarter-to-quarter comparison. This is a signal worth investigating, but it is not sufficient on its own to conclude that Chennai's long-term residential market is declining.
What Do These Figures Mean for Retail Home Loans?
Housing sales and retail home loans are closely related, but they are not identical.
When a household purchases a property using a bank loan, the transaction may contribute to home loan demand. However, some buyers purchase homes using their own funds, while others use loans from different types of lenders. Loan approval can also occur before a purchase is completed.
To understand retail home loan trends properly, the following indicators should be considered together:
Number of new approvals: Shows how many loan applications lenders approved during the quarter.
Total approved loan value: Shows the overall amount of credit approved. This may increase even if the number of loans falls, particularly if average loan sizes rise.
Loan disbursements: Shows the credit actually released to borrowers, which is different from approvals.
Housing sales: Shows the number of residential transactions recorded by the market data provider.
Property prices and affordability: Help explain whether households can realistically afford the properties they want to purchase.
For example, if Hyderabad records increased housing sales and rising home loan approvals, the combination would provide stronger evidence of improving buyer demand. If sales rise but approvals decline, the market may have a different financing mix, or the indicators may cover different groups of buyers.
Without comparable city-level approval data, it would be inaccurate to claim that home loan approvals rose or fell by the same percentage as housing sales.
Real Estate Outlook by City
Bengaluru: The city remained a major housing market, with 17,340 homes sold in FY-Q2. Its employment base, technology sector and infrastructure development continue to support residential demand. The reduction from FY-Q1 warrants monitoring alongside year-on-year sales and inventory data.
Hyderabad: Sales increased to 15,470 units in FY-Q2. The city's technology, pharmaceutical and business sectors support housing demand. Its positive quarterly movement suggests resilience, although loan approval data would be needed to confirm whether mortgage demand also strengthened.
Chennai: Sales declined to 4,680 units in FY-Q2. The city's diversified employment base supports long-term residential demand, but affordability, project location, supply and household confidence can influence short-term purchases. Further data is needed before drawing conclusions about a sustained slowdown.
Mumbai, Navi Mumbai and Thane: These markets serve different buyer segments and should be analysed separately. Mumbai and Navi Mumbai recorded lower sales in the second quarter, while Thane remained comparatively stable. Local infrastructure, prices and property availability can influence buyers' choices across the wider metropolitan region.
Pune: Sales declined moderately from the first quarter but remained high at 17,860 units. Employment in information technology, manufacturing, education and other services supports the city's residential market. Future performance will depend on affordability and whether new supply matches buyer demand.
Delhi-NCR: Sales fell from 10,082 to 8,090 units. The region includes distinct markets such as Gurugram, Noida and Greater Noida, whose performance can vary considerably. A regional total may therefore hide differences between individual locations.
Kolkata: Sales rose from 3,414 to 3,860 units. Although this represents an improvement over the previous quarter, its overall sales volume remained lower than that of the larger markets in this comparison. Sustained growth should be assessed over several quarters rather than from a single increase.
Homes sold · April–June vs July–September 2026:
Conclusion: Is India's Real Estate Market Growing?
The FY 2026–27 Q1 and Q2 figures show that India's residential real estate market is active but uneven. Across the nine tracked markets, reported sales declined from 112,458 units in April–June to 103,170 units in July–September, a sequential reduction of approximately 8.3%.
However, the broader annual comparison provides important context. Housing sales in April–June were 19% higher than in the same quarter of the previous year, while July–September sales were 6% lower year-on-year. The market therefore moved from strong annual growth in the first quarter to more moderate activity in the second.